
ENTERPRISE FINTECH · AI COPILOT & WEALTH MANAGEMENT
AlphaVest — UX Case Study
An institutional-grade wealth management platform concept that unifies portfolio performance, risk analytics, and execution on a single calm surface, paired with an AI copilot that translates complex metrics into plain language.
01 · Context
Background & scope
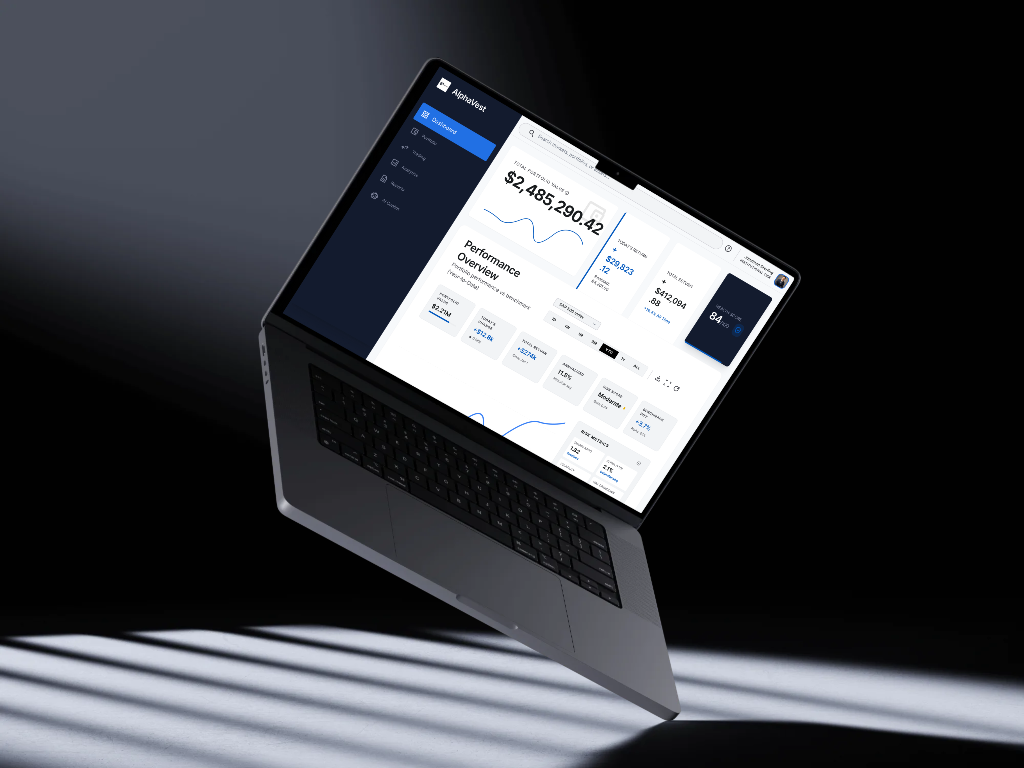
AlphaVest is a self-initiated concept for an institutional-grade wealth management platform that puts a portfolio's full picture—performance, risk, allocation, and next action—on a single, calm surface, and pairs it with an AI copilot that explains the numbers in plain language. Modern wealth management sits at an awkward intersection: retail apps like Robinhood optimize for speed and simplicity but hide necessary depth, while professional terminals like Interactive Brokers expose everything but demand deep expertise to operate. AlphaVest bridges that gap for experienced individual investors, family offices, and advisors managing significant capital who want institutional depth without friction.
02 · Challenge
Core problem to solve
Across competitive benchmarking (Stripe Treasury, Ramp, Robinhood, Interactive Brokers, TradingView, Coinbase, Wise, Charles Schwab) and investor discovery, five structural friction points emerged: landing screens greet users with dozens of widgets at equal visual weight; placing and reviewing an order requires context-switching away from the analysis that motivated it; density is mistaken for value with every metric competing for attention; risk appears as raw unexplained statistics (Sharpe, beta, drawdown) with no plain-language guidance; and AI features are treated as disconnected chatbots rather than an assistant woven directly into the decision flow.
03 · Objectives
What the design needed to achieve
- Improve portfolio visibility with one authoritative surface for value, return, allocation, and health across every asset class
- Reduce cognitive load through a strict visual hierarchy that surfaces high-impact numbers and demotes secondary data
- Increase decision confidence by pairing every financial metric with benchmarks, thresholds, and plain-language status
- Simplify trading workflows by keeping analysis and order execution on the same surface so reviewing, trading, and rebalancing feel continuous
- Support data-driven decisions by making institutional quantitative analytics legible to non-quants without dumbing them down
04 · Key Findings
Findings from audit & discovery
01 · Flat hierarchy on landing surfaces
When every widget carries equal visual weight, users cannot tell what changed or what needs attention in the first ten seconds. The dashboard defers prioritization to the user on every visit.
02 · Numbers without meaning
Metrics shown without benchmarks, thresholds, or plain-language cues create hesitation. A Sharpe ratio of 1.82 is meaningless to most users unless the interface also explains that it represents 'Excellent' risk-adjusted performance.
03 · Broken analysis-to-action chains
The insight that motivates a trade and the ticket that executes it live in separate views. Every context switch is a chance to hesitate, second-guess, or abandon the decision.
04 · Risk communicated as raw statistics
Volatility and drawdown presented as bare figures with no directional guidance erode trust and drive panic or paralysis instead of disciplined long-term stewardship.
05 · AI treated as a bolt-on widget
Standalone chatbot popups fail because guidance is only valuable at the moment of decision, referencing the user's actual portfolio holdings and risk targets.
05 · Design Decisions
How the interface was structured.
01 · One calm surface for analysis + action
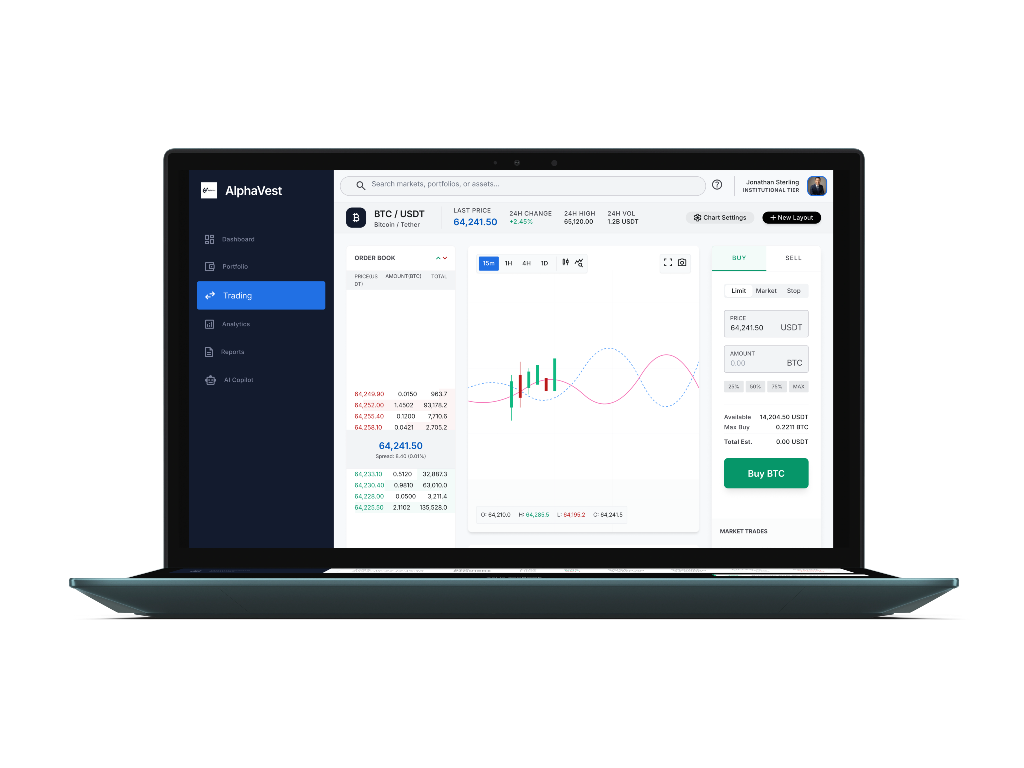
Docked execution tickets directly beside real-time market analysis and asset fundamentals. In both the Trading Terminal and Asset Detail views, the reasoning stays in view while configuring limit, market, or stop orders.
02 · Every number earns its interpretation
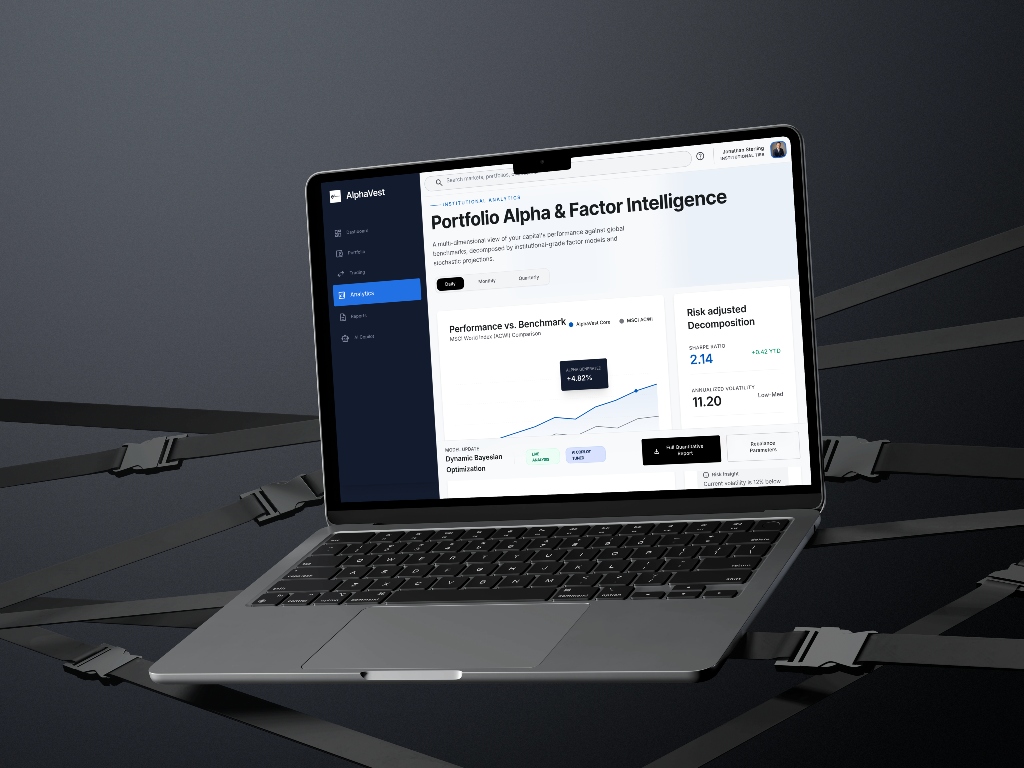
Paired every quantitative figure with an explicit benchmark comparison, status pill, or qualitative health label—such as 'Moderate risk', 'Low to Moderate volatility', or '+0.42 YTD alpha'—turning raw metrics into clear meaning.
03 · Embedded AI copilot with live portfolio awareness
Positioned the AI Copilot as a first-class primary navigation destination with live intelligence feeds, quantifying drift risk (e.g. '+$450k concentrated tech exposure') and generating one-click rebalance proposals with before/after weightings.
04 · Token-driven design system & WCAG 2.2 AA accessibility
Built an 8px spatial grid, high-contrast palette (Brand Navy #0A1628, Surface #F7F8FA, Line #E5E7EB, Action Blue #2563EB), persistent 2px focus indicators, and strict rules ensuring financial status is never communicated by color alone.
06 · Screens & Flows
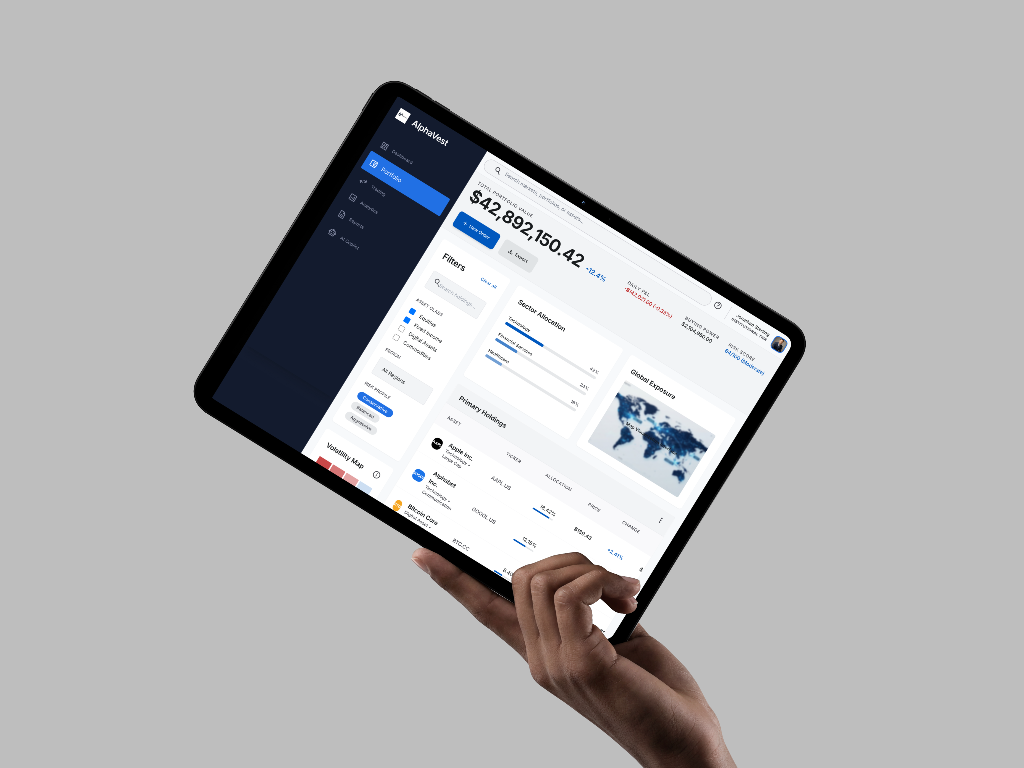
Selected interface views.
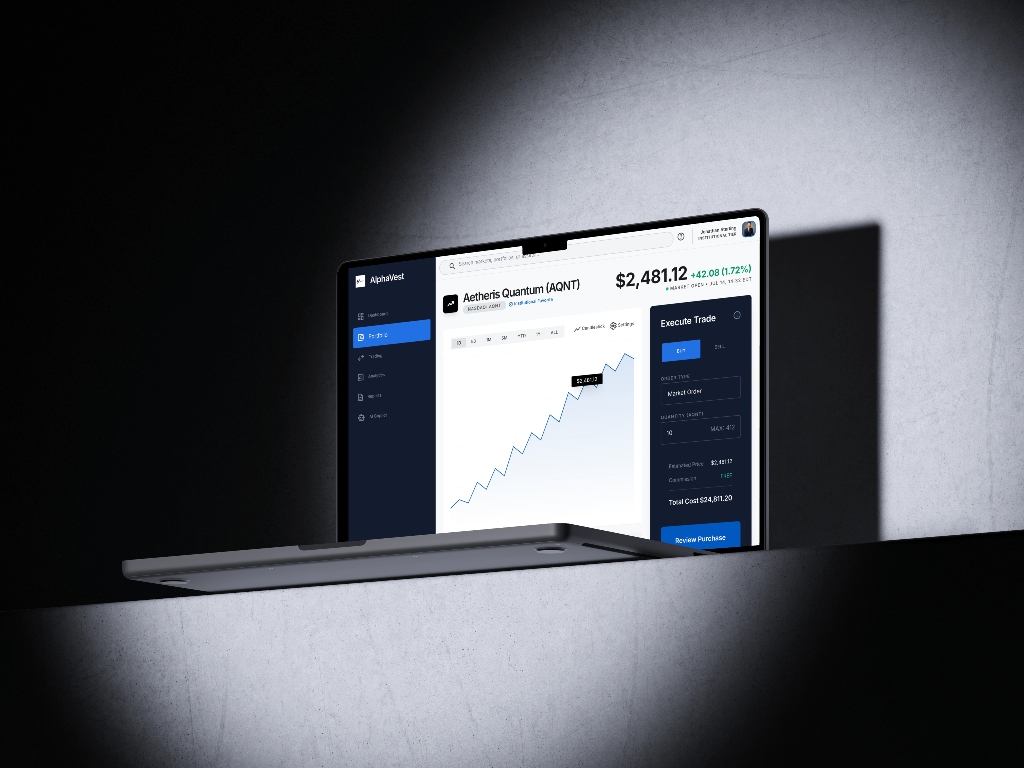
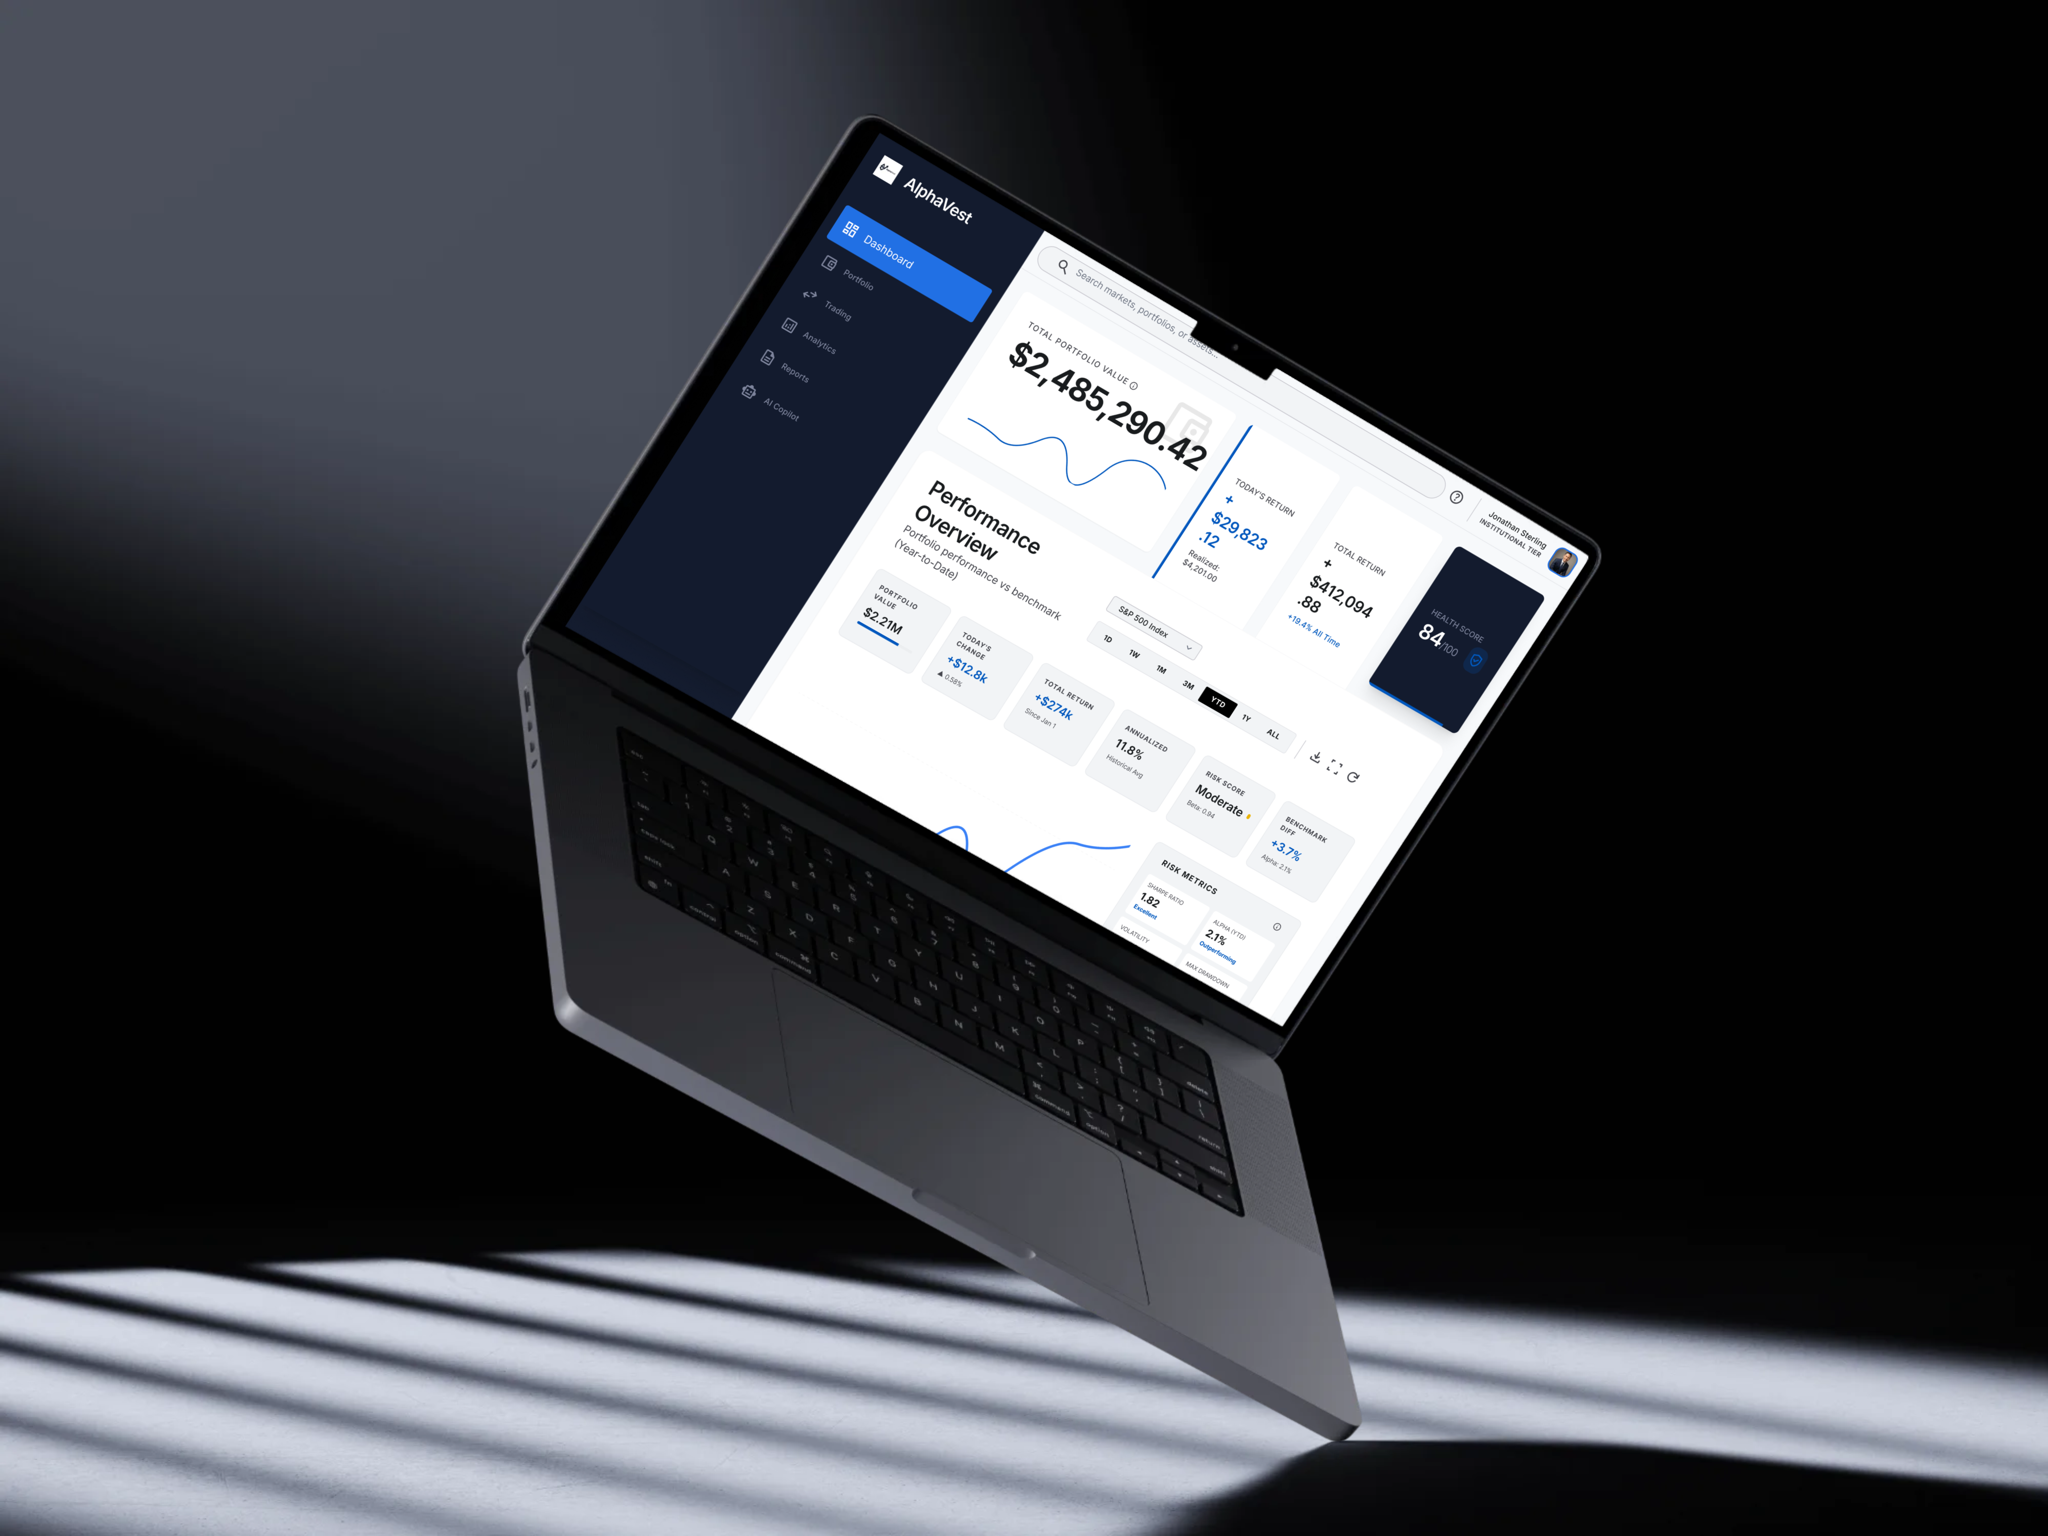
07 · Takeaways
Key product learnings
The hardest craft is subtraction
The natural stakeholder instinct is to expose every data point. The true design craft is deciding what to demote so the primary decision path remains clear, and defending those cuts with research.
Simplifying complexity is not removing it
Experienced investors need depth. The design solution is sequencing: a confident headline figure, immediate supporting context, and full quantitative rigor available on demand.
Trust is a design material
In wealth management, interpretation, transparency, and security cues are not decoration—they are the core product. A number the user cannot interpret is worse than no number at all.
Concept evaluation grounded in thinking
As an independent product exploration, AlphaVest is evaluated on UX architecture and decision support rather than speculative commercial metrics. All UI figures are illustrative.
Explore the complete design system in Figma
Inspect the full 9-screen high-fidelity FinTech interface, design token foundations, component states, and interactive user flows directly in Figma.